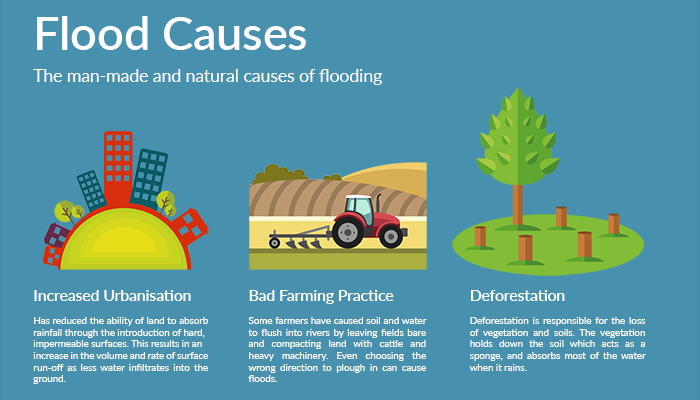
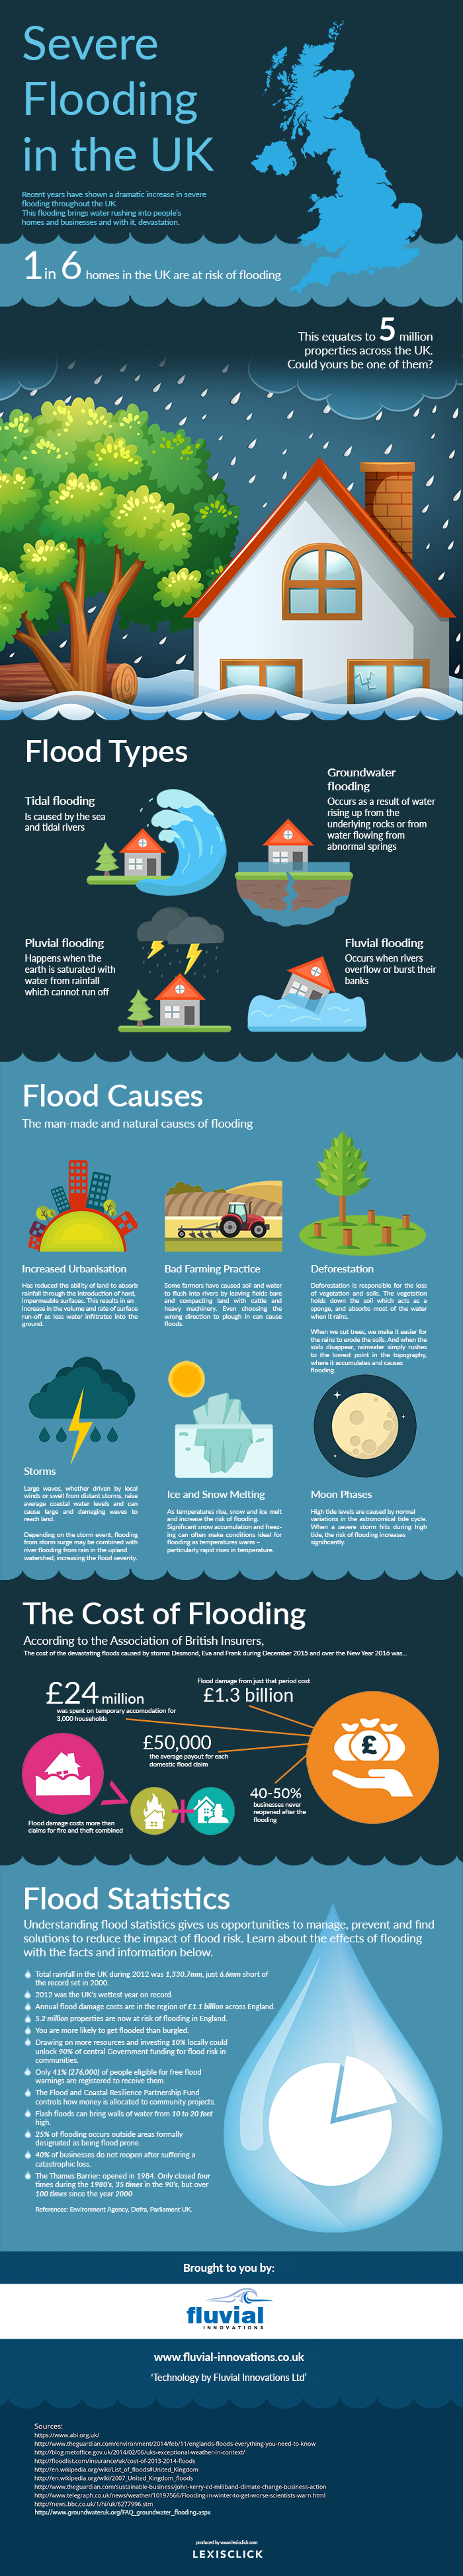
We’ve made this flood infographic as an attempt to visualise the UK flooding stats and facts. Understanding the types and causes of flooding helps us make sustainable decisions for the future. No matter if you believe or distrust the theory of global warming in general, there is evidence that some types of flooding are contributed to by human activity. For example, compacting of farmland due to the recent agricultural boom has changed the UK flood map significantly during the last couple of decades.
Similarly, deforestation is now widely recognised as a cause for several types of natural disaster. Urbanisation and bad management of land resources add to the list of activities that need a global dialogue aimed at developing better practice. Of course, there are causes that we have no control over such as storms and moon phases, however, there are many things that we can influence directly by being more considerate.
With annual flood damage costs amounting to over £1.1 billion, and 5.2 million properties at risk in England alone, we are making a good case for rethinking the way we manage our natural resources. While we can make a New Year’s resolution of trying to lead a more sustainable lifestyle, it won’t change things in the short term. That’s why it’s important for households and businesses to think about suitable flood defence systems. An average household insurance claim is £50,000 and more than 40% of small businesses never reopen after sustaining a flood damage.
If you liked our flood infographic, why not share it with your friends or even reblog it using the code at the bottom of the article.
Share this infographic on your blog by using the code below: